
Clarity That Scales
Insights for Leaders Navigating Growth
Welcome to the District Analyst blog—where data meets decision-making. This isn’t just another analytics feed. It’s a space built for leaders who are scaling fast and need sharp, strategic insight to match.
Here, we go beyond surface-level trends. Each article is designed to help you understand the metrics that matter, make more innovative moves across your funnel, and stay ahead of the curve as your business evolves.
Whether you're prepping for a raise, tightening your ops, or aligning your team around the right KPIs, we’re here to make your data work harder, faster, and smarter.

The Power of Facebook Insights
Have you posted in the past without much engagement from your audience? You are not alone. Even if you have built up an audience for your page, they may not ever see the content that your are posting! Facebook offers a secret weapon to help inform your strategy and execute with precision: Insights.
How to Setup Google Analytics
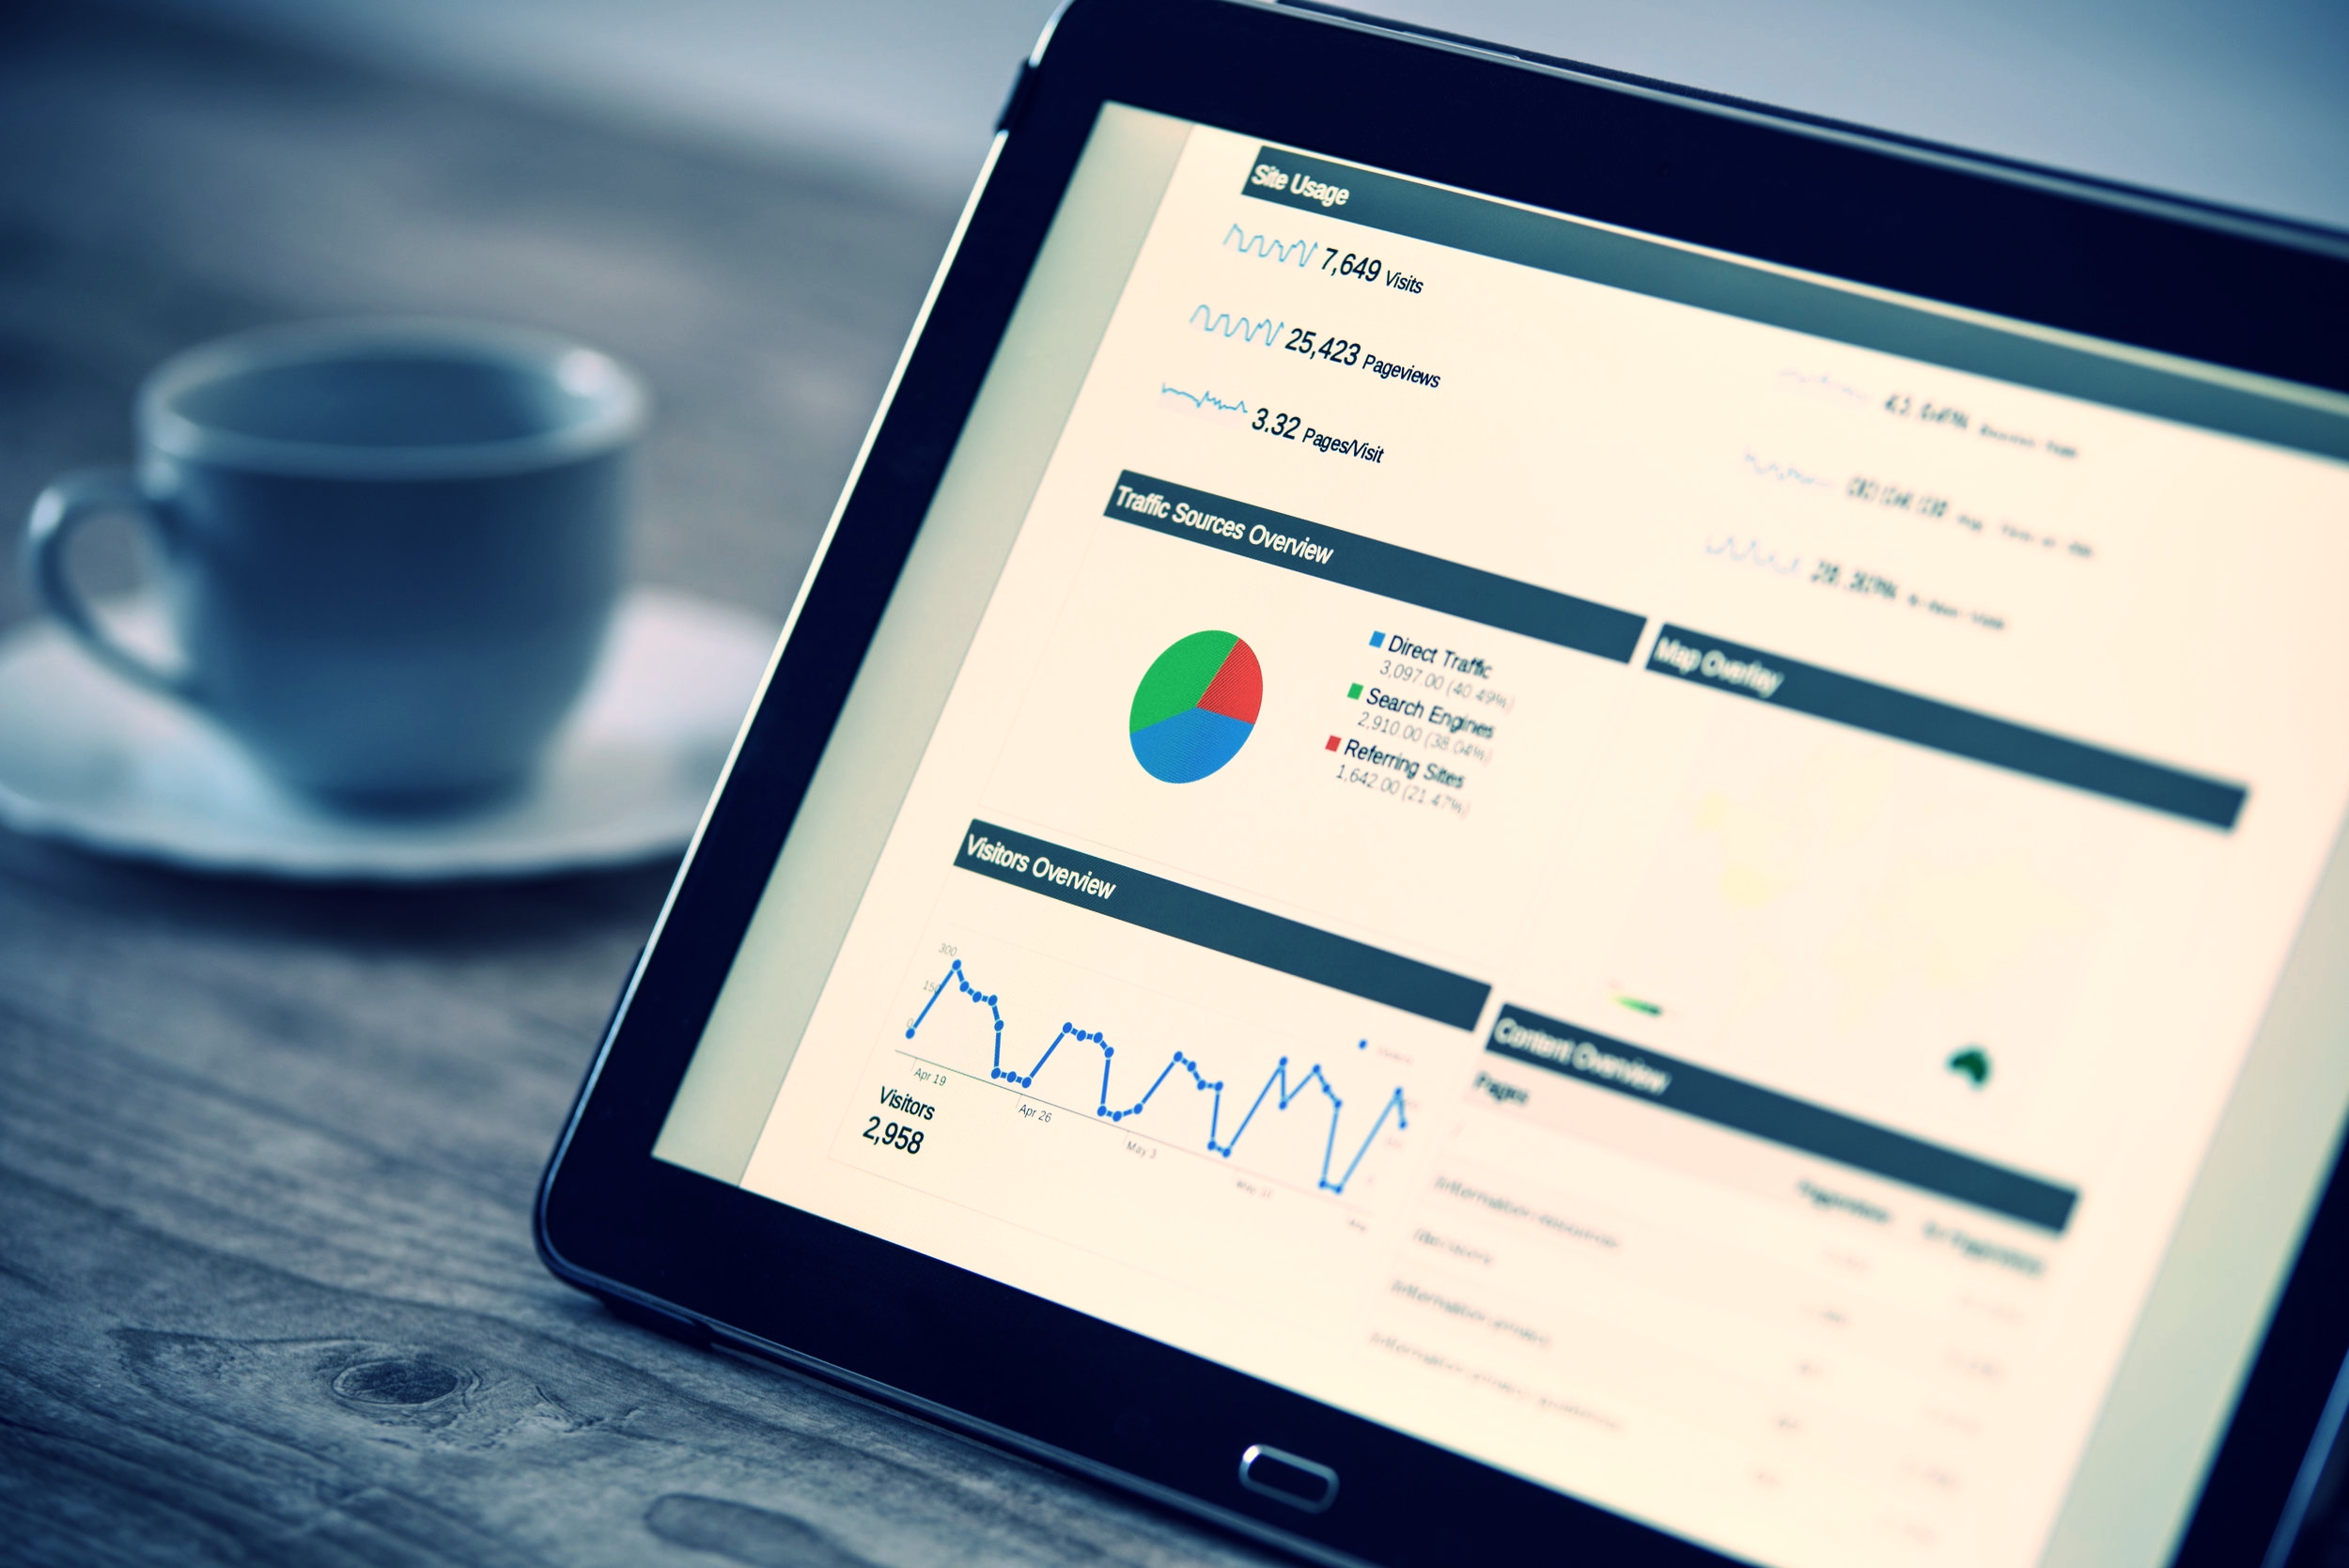
From creating digital sales funnels to identifying customer retention tactics, Google Analytics helps you understand your website’s visitor behavior quickly and effectively. Understanding visitor behavior is key to launching new products, streamlining customer interactions, and optimizing your website for success.

What to Consider When Hiring a Data Science Team
In this article we will discuss what to consider when hiring a data engineer, a data analyst, a business intelligence developer, and a data scientist. Keep in mind that for a successful data driven organization emphasis must be placed on developing capable teams rather than individuals. A variety of background and experiences bring improved efficiency to the team.

6 Indicators You Need a Data Science Team
To be successful at gathering insights from data an organization needs a team of experts with various skill sets to complement each other and work collectively towards a common objective of getting value from the organization's data.

What Does A Data Analyst Do?
Businesses generate large amounts of data from many activities such as sales, customer relationship management, order management, logistics and market research. To benefit from these data assets your business needs to organize, analyze, and interpret your data.

How Interpreting Data Improves Your Business and Profitability
Modern business management is made up of three pillars. These pillars include data, analytics, and business operations. Businesses generate large volumes of data and often struggle to get value from these data assets. Once data is understood it is easier to develop projections, improve operations, and reduce waste.

How to Present Data and Findings
Business Intelligence tools are used to identify insights from data repositories. These BI tools connect to different data sources and enable data analysts to equip decision makers with relevant insights from the data.

How to Analyze Data
After your team and data analyst have finished setting your objectives and gathering data you need to analyze your data to meet your objectives. When analyzing data you can use descriptive, visual, inferential, or modeling techniques. In this article we discuss various data analysis techniques and tools to use in analyzing your data.